Search Auto-ethnography: Missing Places and How I Learned About Them
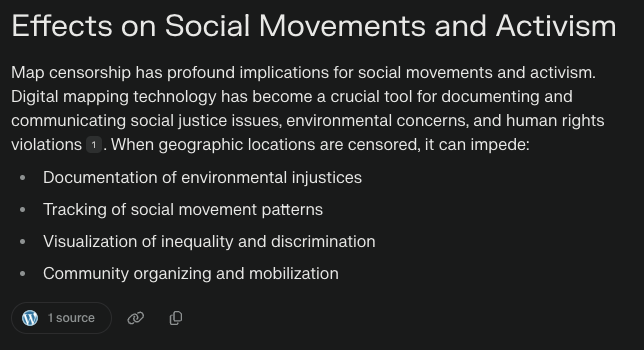
When I go somewhere new, whether it be navigating to the Mathematical Sciences Building on the first day of college, or exploring a new part of my grandparents’ town in Kerala, India, the first thing I do is open Google Maps. It’s amazingly simple for the layperson to understand: they open their phone, turn on data, and now they can see not only where they are, but also where other important places are and how to get to those places. Behind this simplicity for the user, however, is rigorous testing for user experiences, complicated pathfinding algorithms calculating the most efficient ways to get from A to B, and enormous amounts of data collection; and where there is data to be collected, there is data that is manipulated to oblivion, muzzled by foreign powers. My goal was to see how well I could learn about this issue from different methods, conventional and not so much.
Wikipedia:
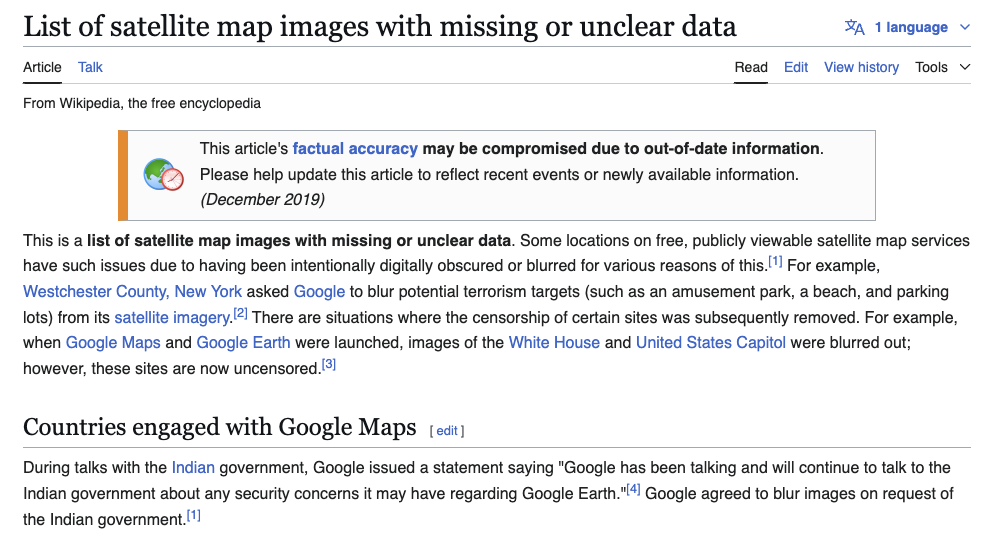
While not considered a common method by high school students who are taught not to trust it (due to possibilities of trolling and inaccurate information in its entries), Wikipedia can act as a better version of Google search if you put in the effort, just by using the sources at the very end. From here, I found articles about Google blurring parts of India, Spain, the Korean peninsula, Indonesia, and even Antarctica (though that may be due to the fact that most of Antarctica is very reflective and thus hard to photograph).
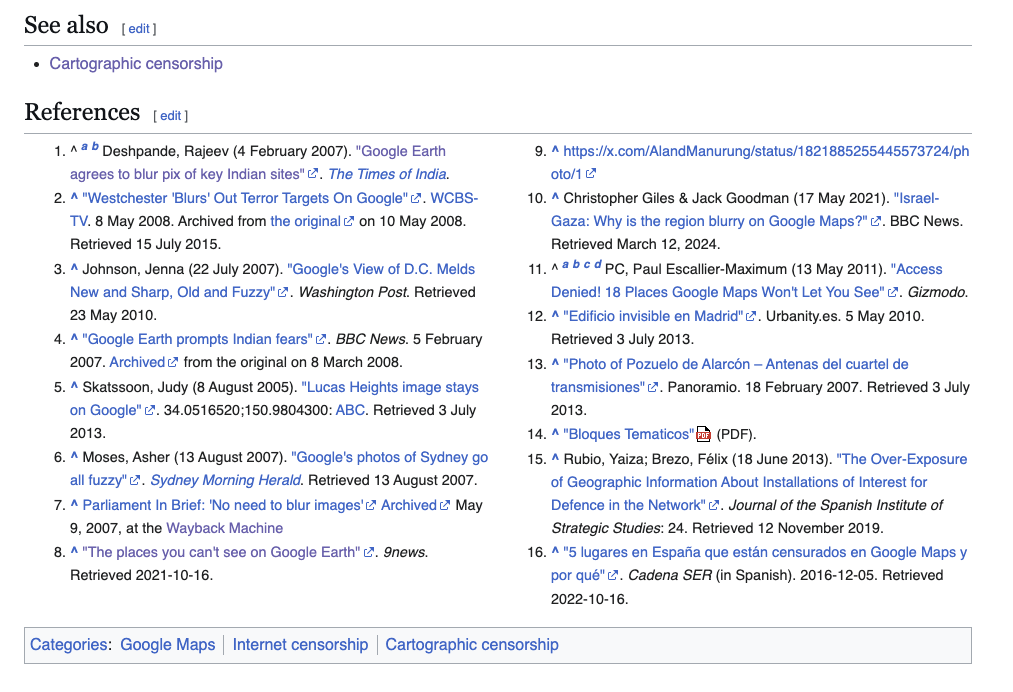
Wikipedia led me to learn about cartographic censorship, where countries have historically used location data for economic and political gain, sometimes by restricting access to information about new discoveries to profit from them. I did notice that some of Wikipedia’s sources were old, which can be a problem with crowdsourced research. However, the mix of old and new sources helped show how widespread this issue is, more so than Google Search did. Also, for articles that haven’t been heavily edited by many people, the sources tend to be reliable news outlets. This made me trust Wikipedia more than Google Search, where SEO can sometimes affect the information you find, as websites try to optimize for Google’s algorithm.
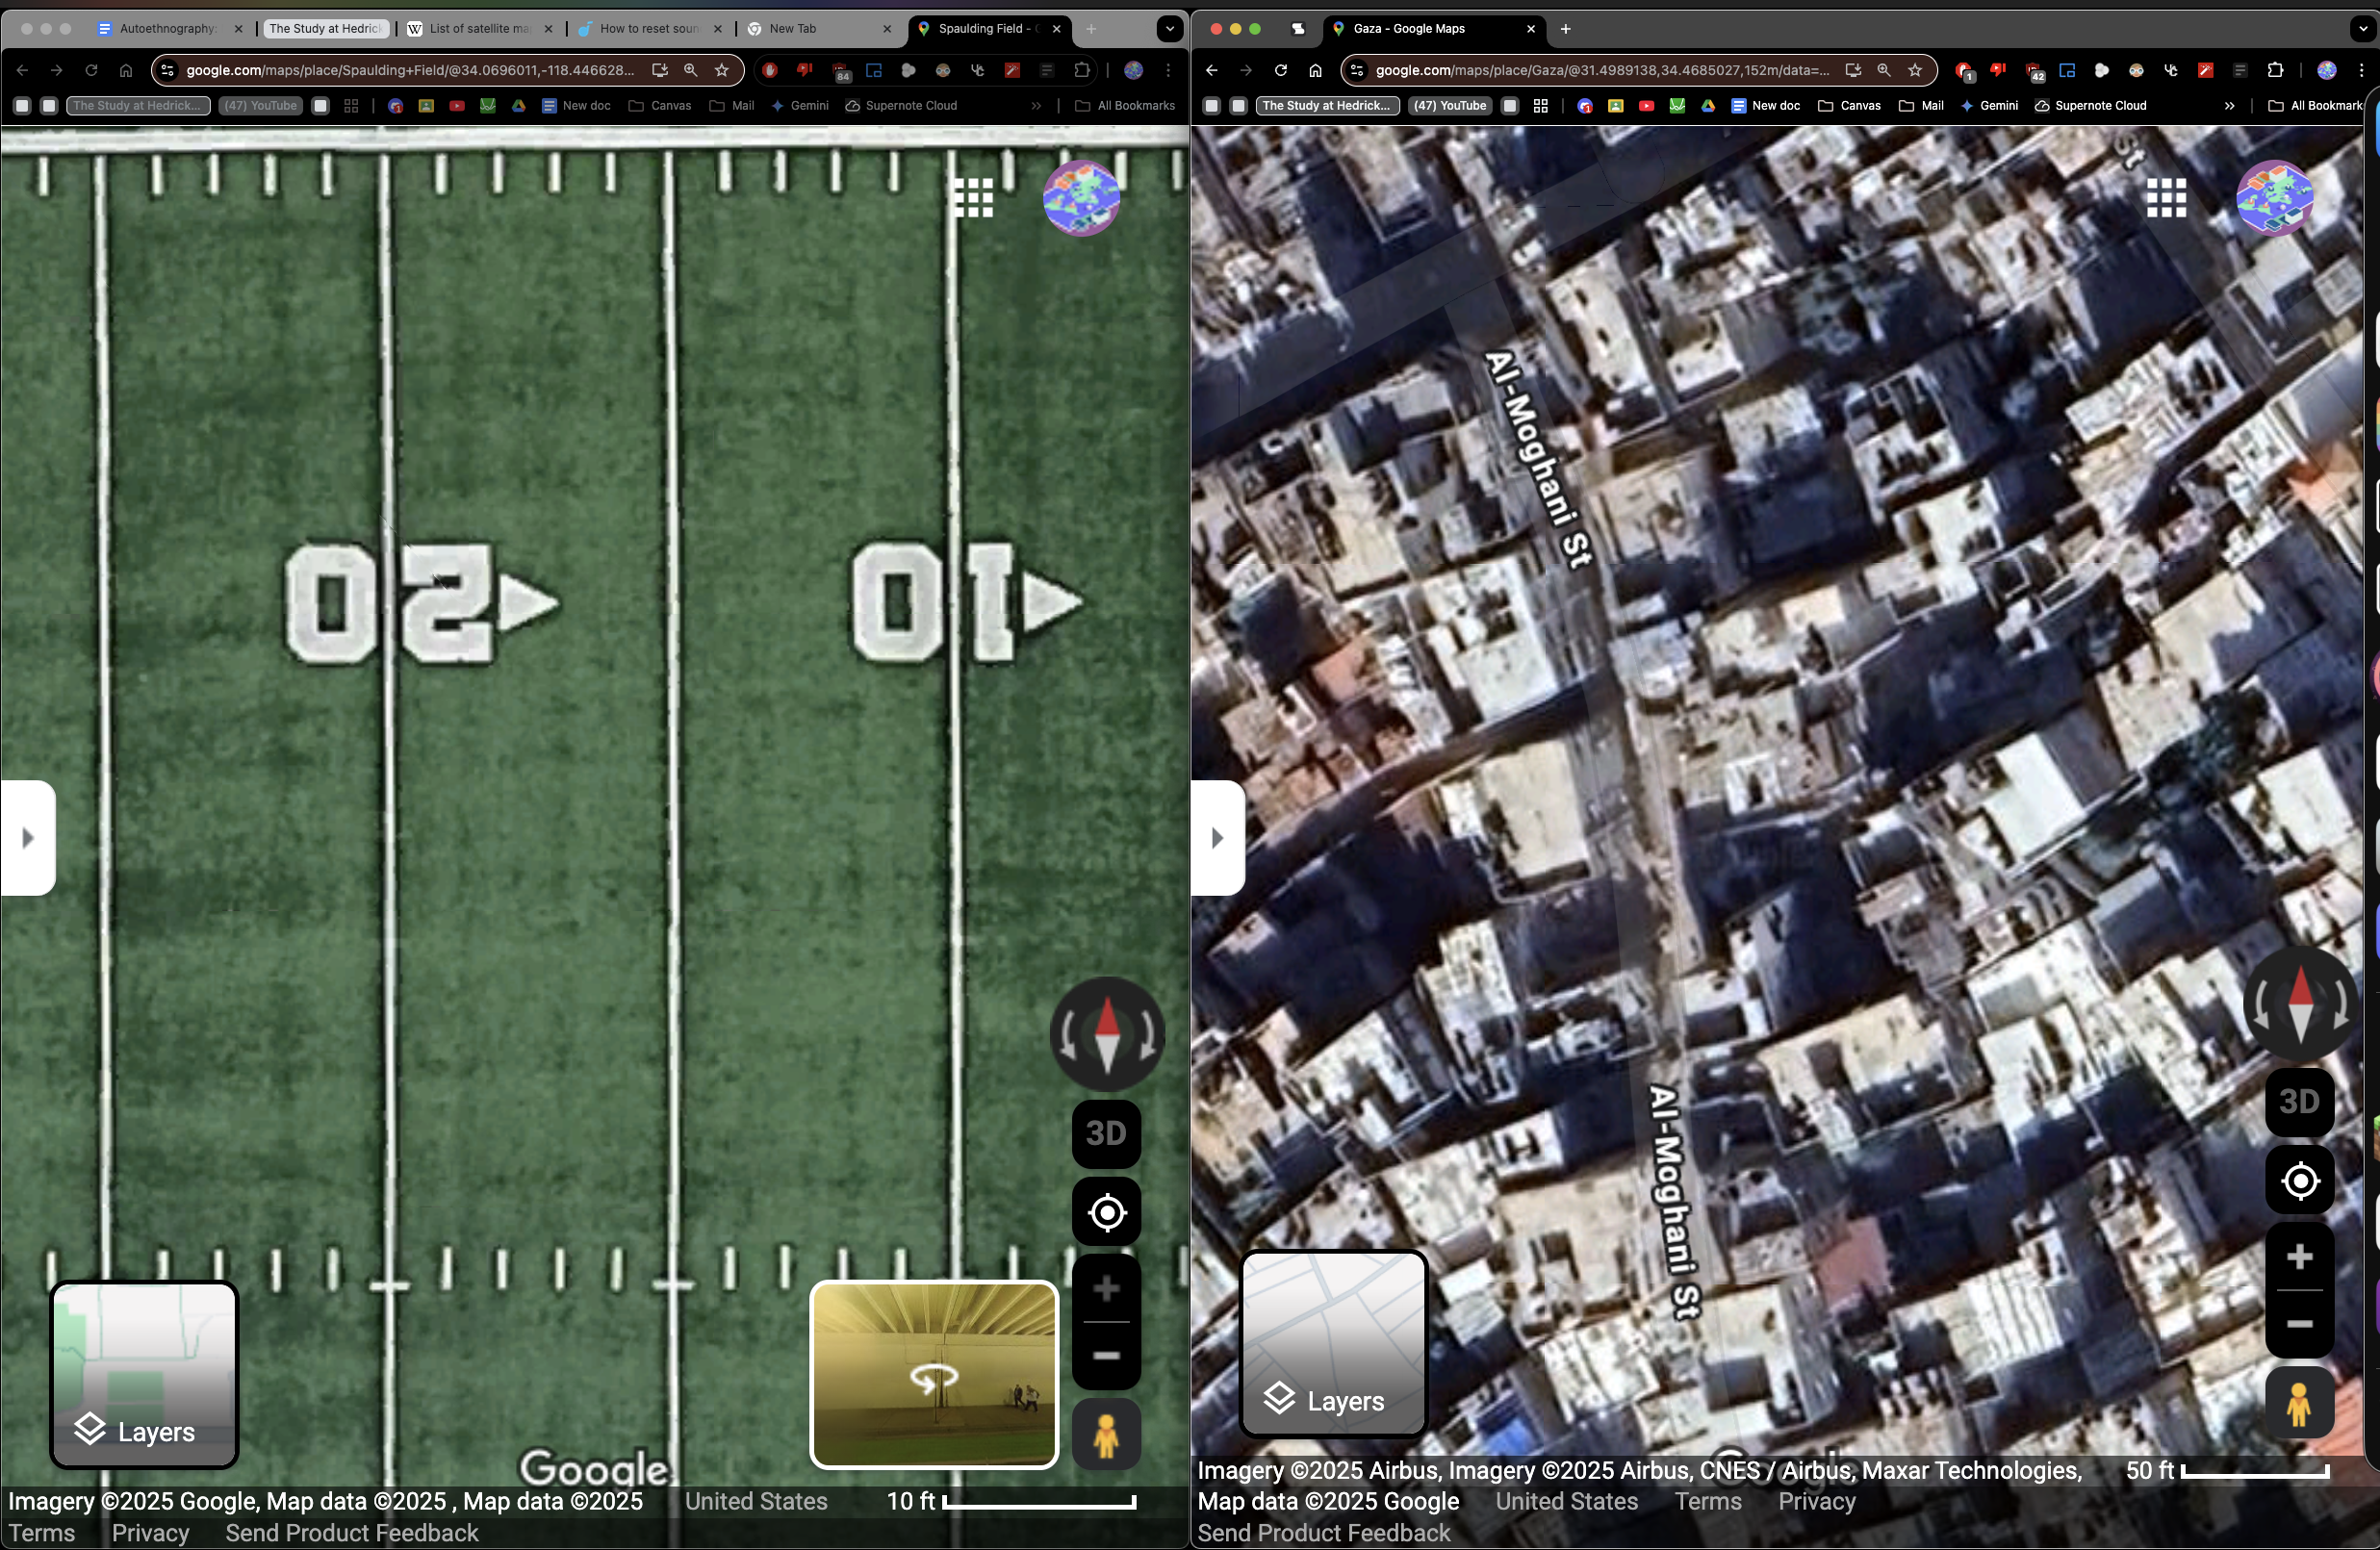
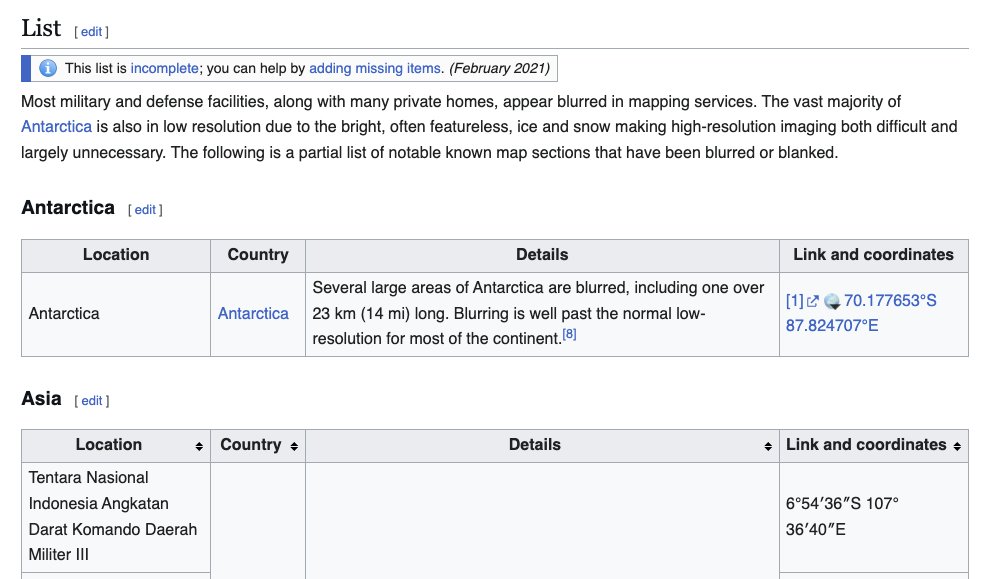 Even with an incomplete list of places, the locations noted are detailed thoroughly, allowing me to verify if areas are still blurred. For example here’s the max zoom of the Gaza strip vs. the east endzone of UCLA’s Spalding field (the UCLA one has 5x the resolution in spite of both being satellite imagery)
UCLA Library: “Map censorship” For our last assignment in our Data Justice and Society class, we learned how to look up information on our library database, and that was a method I wanted to try for this topic:
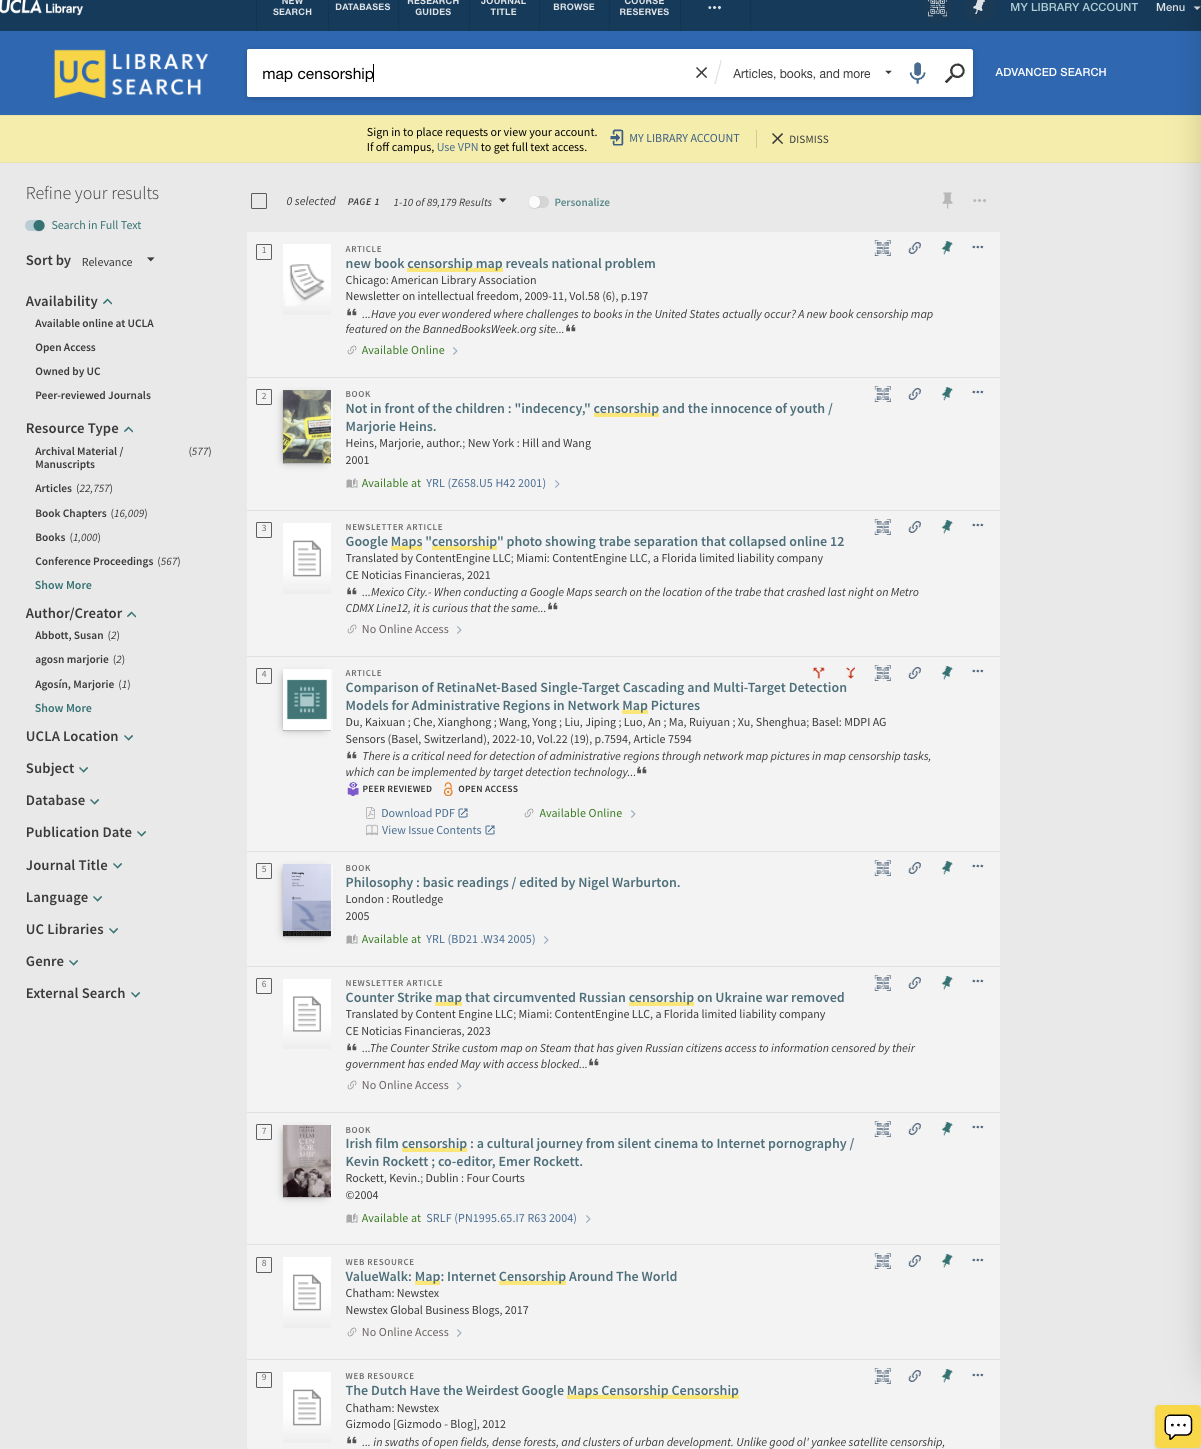
Like Wikipedia, I could be certain that these were credible sources since they were human curated at a reputable institution, but unlike Wikipedia, which is crowd sourced information and thus suffers from the tragedy of the commons, UCLA is funded by other ventures (like high tuition) and thus can afford (and must afford) to not only add more current information but also archive older information and preserve it for as long as possible, allowing me to find obscure information related to map censorship, like an artist using Google’s censorship of the Netherlands to make composite art pieces.
Deep Research Method:
Google and Perplexity both had deep research methods that I could use, but it wasn’t their content I was looking for; like the others, I wanted to see what they based their research off of and read that instead.
Perplexity preferred to stick to the topic, but was very general with its answer; I got more reading about cartographic activism on maplibrary.org than I did reading Perplexity’s summarization.
Google gave extra context for the problem behind map censorship, and had lots of sources to read afterwards, including documentation on how Google Maps gets its data, which led me down a rabbit hole of different nation’s laws on what locational data outsiders can have. Overall, I expected more from something that’s considered a premium and easy to use service (both of these normally cost $20 a month to access) but when used solely for getting access to large amounts of sources to read through yourself, it’s worth it so you can get an overview from the AI before diving in.
My favorite method: Talk to someone affected by it
One of my classmates is South Korean, and he was interested in seeing the differences in using google maps vs his main app while navigating in South Korea, so during dinner, we got our map apps out and got some pictures:
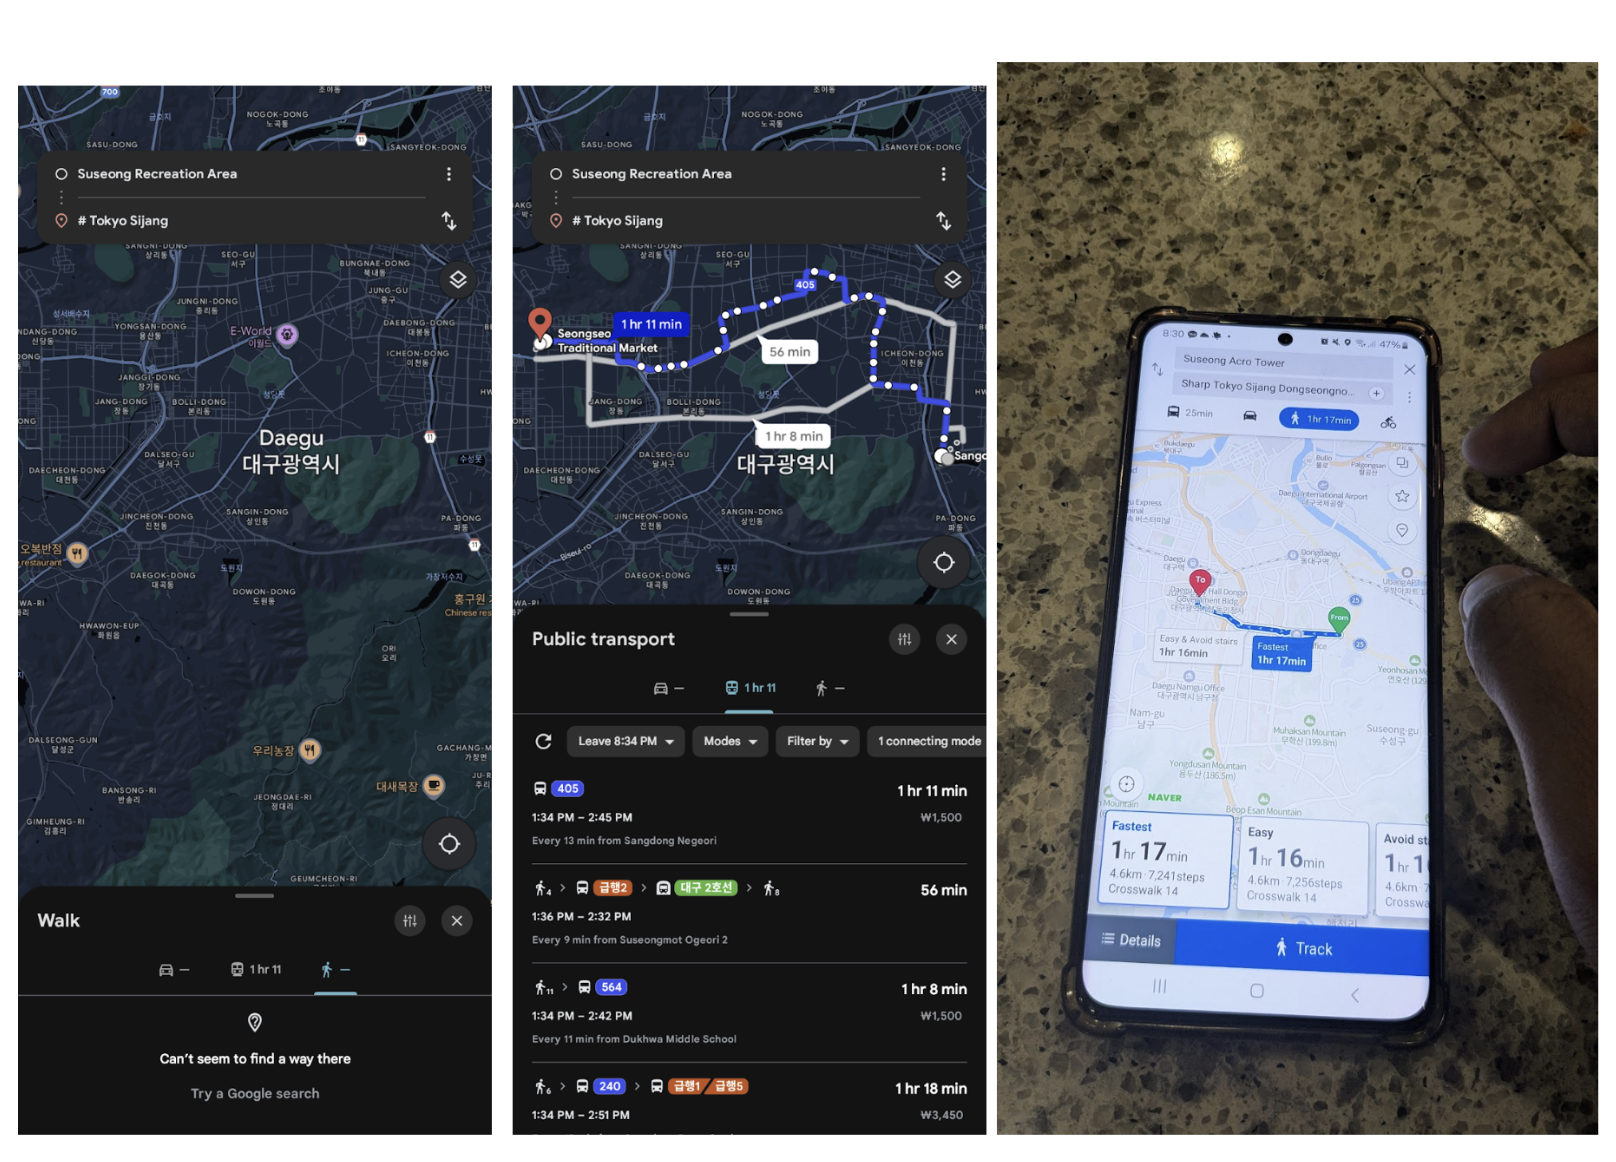
It’s crazy that I, an international traveler, wouldn’t be able to navigate South Korea by foot or by car using Google Maps (not even talking about reduced resolution), a service I trust to be able to take me almost anywhere. It’s because of the Spatial Data Industry Promotion Act which “contribute to the development of the national economy and the qualitative improvement in national life by strengthening the competitiveness of the spatial data industry and promoting the development thereof.” By “strengthening the competitiveness”, they mean giving the data to two chaebols in-country so they are the ones you rely on for everything. Anyway, we also had a long conversation about chaebols and their influence on Korean society due to their large power over the country, which led us to talking about China, who we discovered, has some fun with the locational data they send Google:
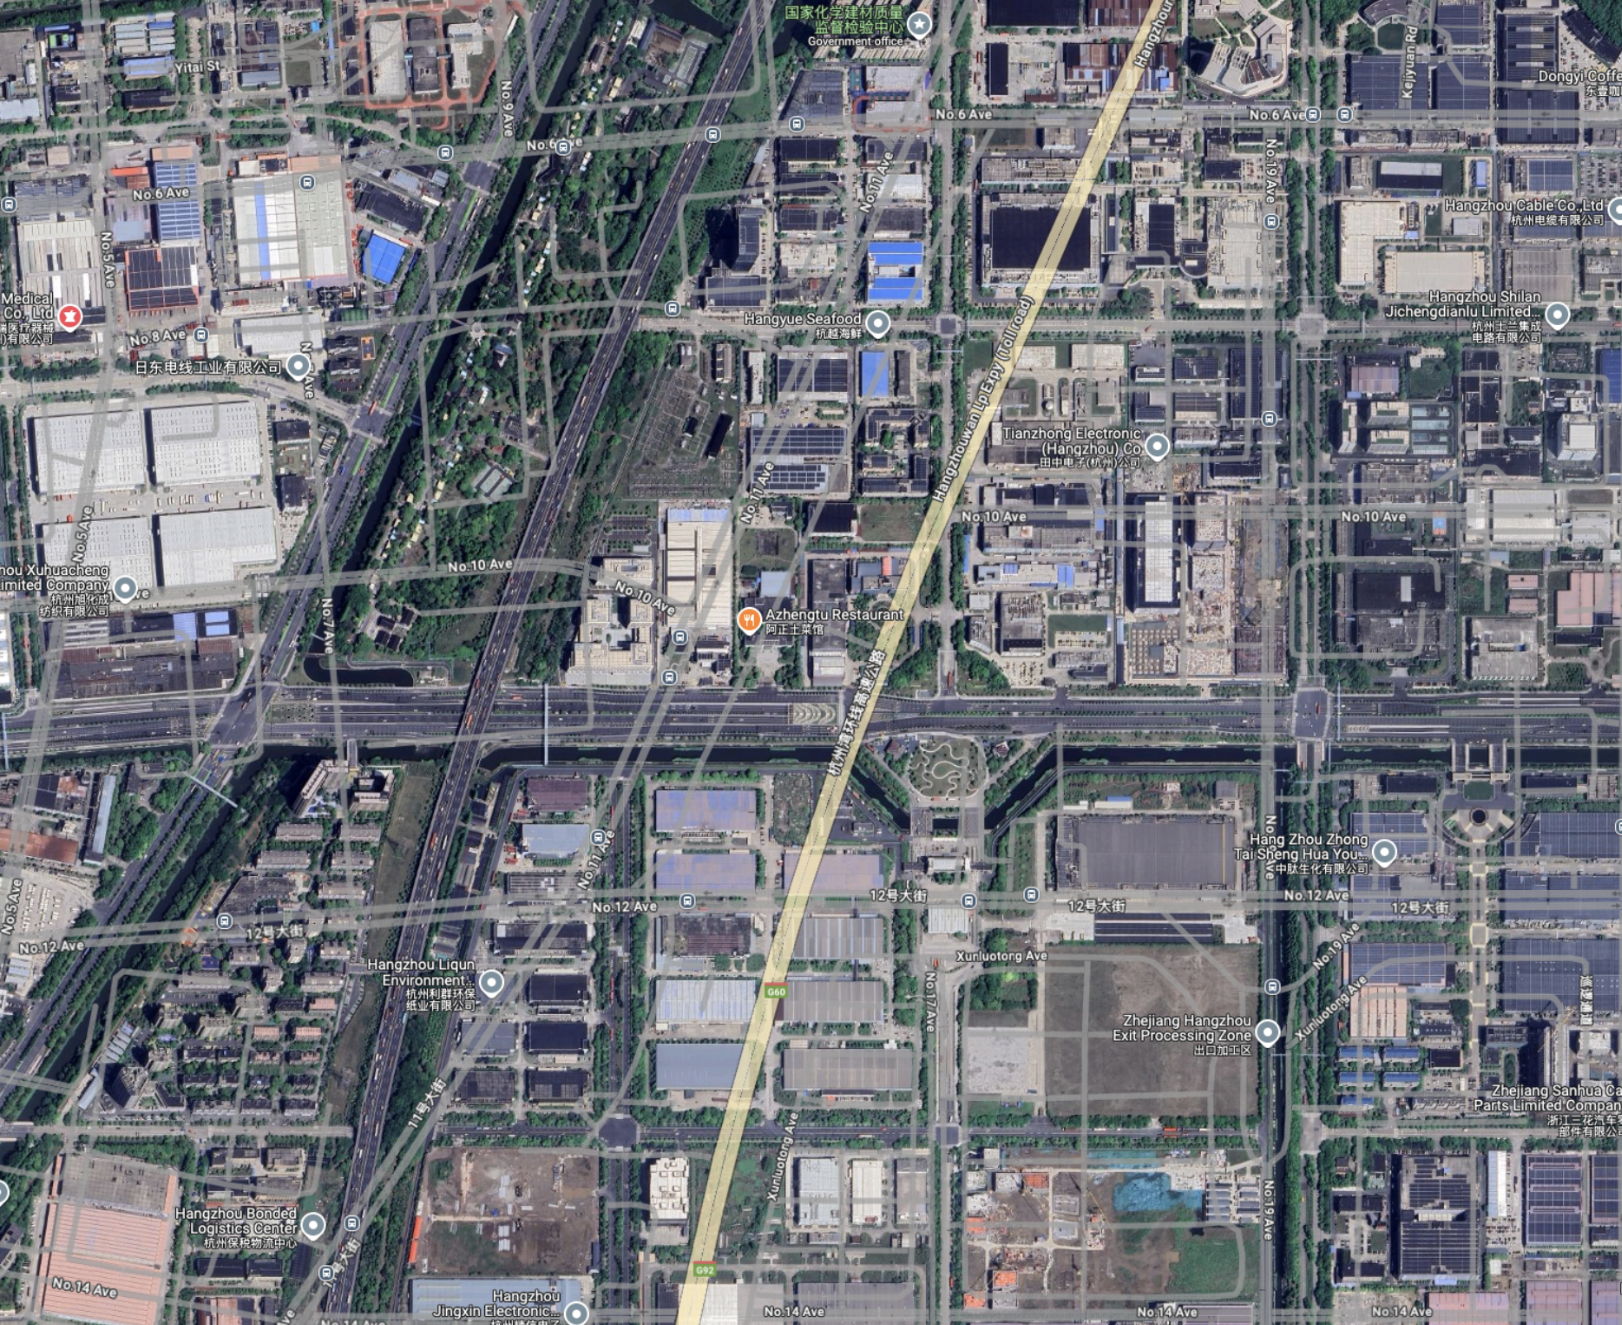
Notice the grey overlay? That’s where China told Google its roads are; China has accurate mappings of them, and Google has accurate images, but China feeds Google algorithm shifted data due to a Chinese prohibiting mapping the country without permission.
My favorite part of this kind of research was literally doing research like my professors do, going out in the field, getting their hands dirty, speaking to new people, getting new perspectives, and most importantly, learning from each other. I knew that China altered its map data, but I didn’t know too much about Korea and was intrigued by the power of the chaebols in South Korean life, and my Korean friend had fun learning about being able to drive in the South China Sea (this is due to the algorithmic shift, you cannot actually drive in there)
What did we learn from this?
So this article is heavily based on two assignments from my UCLA Cluster course “Data, Justice, and Society,” an interdisciplinary course combining information studies with its practical use in social justice by critically analyzing how data is collected, stored, interpreted, and used in everyday life. The first was an analysis of different search methods when researching a demographic (I did male college students), and our current assignment is a reflection (that’s what autoethnography means) on our experience searching up information for our final paper on a missing dataset (hmm, I wonder what mine will be about??)
My conclusion is that you need to have some fun with your research. Sure, you can get Perplexity and Gemini to do your research for you, and spit out sources and summaries for you to process like an LLM, but I enjoyed this assignment a lot more when I went onto Google Maps to trace out a highway passing straight through a public park in China, directly seeing what effect this form of map censorship had on me. So if you need to do research on something, get in the weeds a bit. Try the tech, talk to people, and get involved in the community that you are trying to study.